Fed has found an alchemy that depends on a temporary condition of faith in instability.
Frank Bellini's Posts (12)
the president is briefed “quite frequently” on the scope of surveillance operations, it would be “unrealistic” to think his staff regularly goes over specific details, such as explicitly how or when the intelligence is being gleaned.
I think my cat is a Republican!
Seemingly NOT counted against the US debt ceiling is the $Trillion/year used for quantitative easing by the Federal Reserve.
4 years ago our US money supply was $0.85 Trillion. It is now approaching $4 Trillion!
UNbelievable that NPR radio and the Washington Post are calling these killers "militants" and not the murdering muslim al qaeda terrorist they are.
At least that is what the markets are letting known is the driver and that is certainly part of the story.
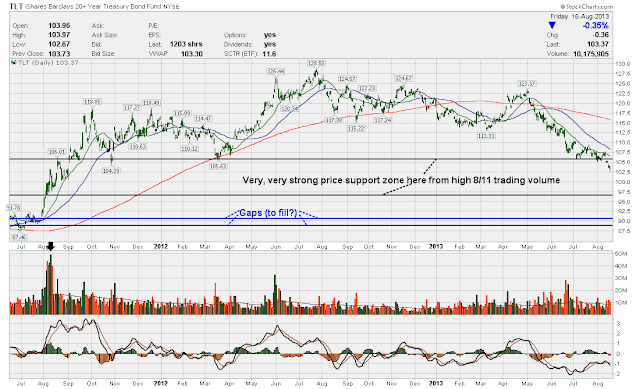
Traders see through the stories but pay attention to them as well as the larger picture. Here is the TLT, an ETF representing 20 to 30 year bonds; rising interest rates have been killing it price:
If, that linked article is right, 10-year rates are going to 3%, that could put mortgages and the 30-year up towards 5% -- without the FED moving the overnight rate (the only rate they really control). The market may see that as a way to keep Fed rates low longer (Bernanke threatened an increase on May -- see the result on the chart above). All rates are linked together from short to long - see the yield curve here. The "longer term rates" must stay above the "short term rates" for banks to stay profitable -- they make a lot of their money from the "carry" between the rate times, borrowing short and lending out long. Play with the graph on the right and move a vertical line (that appears when you click on it, or you can animate it with the button) across the time scale. Note the inverted curve (shorter rates higher than long term rates) at the 2000 stock market peak and the similarly flat curve at the 2007 stock market peak. Compare that to our current yield curve, held artificially low by the emergency (going on 6 years) federal policies, anchoring it at 0%. Normal economic cycling has been suspended by the 5-year emergency measures!
"So we want stocks to go up for years? Well hold down interest rates -- a crappy economy will help. So what if it cripples growth to a crawl? We will worry about that later. What a juvenile selfish approach to managing our economy!
Note the move to near 0% (bottom of the yield curve at the origin of the graph) overnight rates in 12/07, carrying through the present -- what makes that possible is the almost unlimited printing of money (TARP, QE1, QE2, Operation Twist), massively inflating the US money supply (To make matters worse, most foreign countries are in the same boat or even worse off!). While stocks may retrace in price somewhat, until that policy is rescinded (or at least there is an announcement of a time-table for rate adjustment (up), stocks should be buoyed at some intermediate level. If they start to drop very low, despite the extremely loose money policy, that would be a very very bad sign for the market as well as the economy.
TLT should bottom out around 90 to 100. If stock prices fall steeply, bond prices are likely to rise again.
http://i182.photobucket.com/albums/x145/brityank/health_care_chart.jpg
Constraints on energy and natural resource production, as championed by the Obama administration, sooner or later show up in our energy bills. Gasoline for our cars is the most obvious result. But take note of these price increases in electricity over the winter:
"Trends in power prices were generally set by higher natural gas prices in 2013 compared to 10-year low prices in April 2012."
Don't expect the mainline propagandizing media to take up the gauntlet here.
Using a strategy never before employed on the current scale, the federal government has succeeded in inflating the U.S. money supply to grossly unstable levels. Here is a graph of this insanity from the Federal reserve, itself:
Our currency, our country cannot long endure such insanity. The hyperinflation that this tempts, prompted by the first signs of the return of prosperity, will cripple the country's economy. This will be Obama's enduring legacy, likely to be blamed on the next president when it occurs.

